CEID COVID-19 - News
Latest News and Updates
(http://covid19.uga.edu/tracker.html)
Coronavirus Tracker updated with county-level COVID-19 cases and deaths
CEID’s COVID-19 Tracker has been tracking hospitalizations, deaths, and tests, for all countries and US states. The tracker has now been updated to include cases and deaths at the county level for each US state.
The tracker allows users to investigate the data in multiple ways. For instance, through June 7, by exploring cases per 100K, the data show that Dougherty County, GA (Albany, GA), with a population of ~94,000, reported 169 total deaths per 100K. Bigger counties, such as Fulton (~1 million residents), Gwinnett (~20,000 residents), Cobb (~755,000 residents), and Dekalb (~753,000 residents), which are part of metropolitan Atlanta, report similar total deaths but lower numbers per 100K (Fulton – 23; Gwinnett – 14; Cobb – 25; Dekalb – 16).
This updated visualization tool provides public health professionals and the general public additional insight into the spread of the SARS-CoV-2 virus.
The COVID-19 Tracker was developed in partnership with the University of Georgia’s https://publichealth.uga.edu/<> and is updated daily.
Details: http://covid19.uga.edu/tracker.
Questions: Dr. John Drake (jdrake@uga.edu).
(http://covid19.uga.edu/stochastic-GA.html)
Stochastic model with social distancing for Georgia
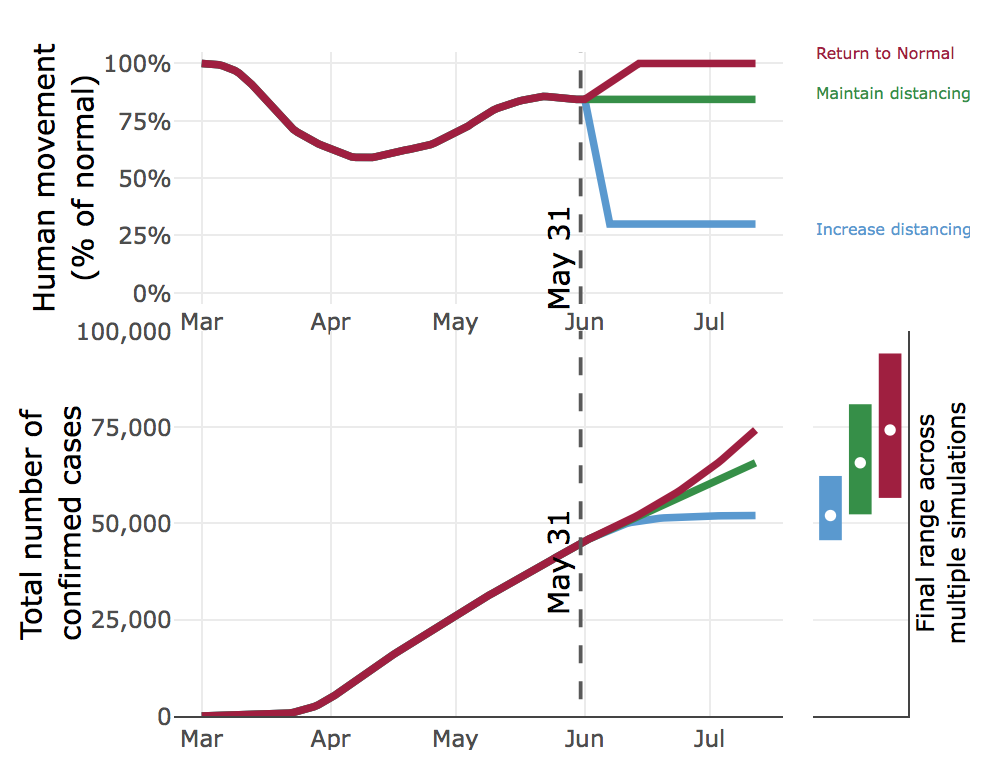
CEID’s stochastic model of the COVID-19 outbreak in Georgia has been updated to reflect how changes in social distancing (as measured by mobility data), combined with hard-to-capture behaviors like wearing a face mask, affect the COVID-19 pandemic in Georgia under a range of scenarios. The new model includes pre-symptomatic and a-symptomatic individuals, undetected infections, confirmed cases, hospitalizations, deaths and recoveries. The model is fit to reported cases and deaths, movement data (anonymized state-wide cell phone data to track movement), and a temporal trend in baseline transmission capturing other human behaviors.
The model considers three social distancing scenarios, using the mobility data as a measure of social distancing. Specifically, we looked at returning to normal mobility, maintaining mobility at current levels (currently about 85% of normal), and decreasing mobility to 30% of normal.
The model considers the effect of each scenario on the number of cases, hospitalizations, and deaths, forecasted six weeks into the future. For example, if Georgians cease social distancing and return to normal movement beginning on June 2, by July 12 there will most likely be over 74,000 confirmed cases. However, by the same date, maintaining our current level of mobility (85% of normal) would result in about 9,000 fewer cases. Increasing social distancing and reducing mobility to 30% of normal would result in 22,000 fewer cases as compared to a complete return to normal. These data clearly indicate that social distancing does have a pronounced effect on the COVID-19 epidemic curve.
The model is updated daily. Future projections are 6-weeks ahead.
Details: http://covid19.uga.edu/stochastic-GA.
Questions: Dr. John Drake (jdrake@uga.edu).

Feature article by John Drake on FiveThirtyEight
FiveThirtyEight.com published a feature article by John Drake: “Why One Expert Is Still Making COVID-19 Models, Despite The Uncertainty.”
Read the full article at FiveThirtyEight.
(http://covid19.uga.edu/tracker.html)
New Tracker for Cases, Deaths and Hospitalizations
The Center for the Ecology of Infectious Diseases (CEID) and the College of Public Health (CPH) at UGA have created a new interactive tracker that allows users to visualize the spread of COVID-19 both in the U.S. and worldwide. The tracker allows users to explore cases, hospitalizations, deaths and number of tests for every U.S. state, as well as cases and deaths worldwide. Users can adjust the plots by choosing total or daily numbers, absolute or normalized values, and calendar date versus date since a certain number of cases occurred. The data comes from the Covid Tracking Project and the Johns Hopkins University Center for Systems Science and Engineering.
Stochastic model for Georgia
The COVID-19 Portal now includes a stochastic model for the outbreak in the state of Georgia. http://covid19.uga.edu/stochastic-GA.
Nowcast of outbreak size
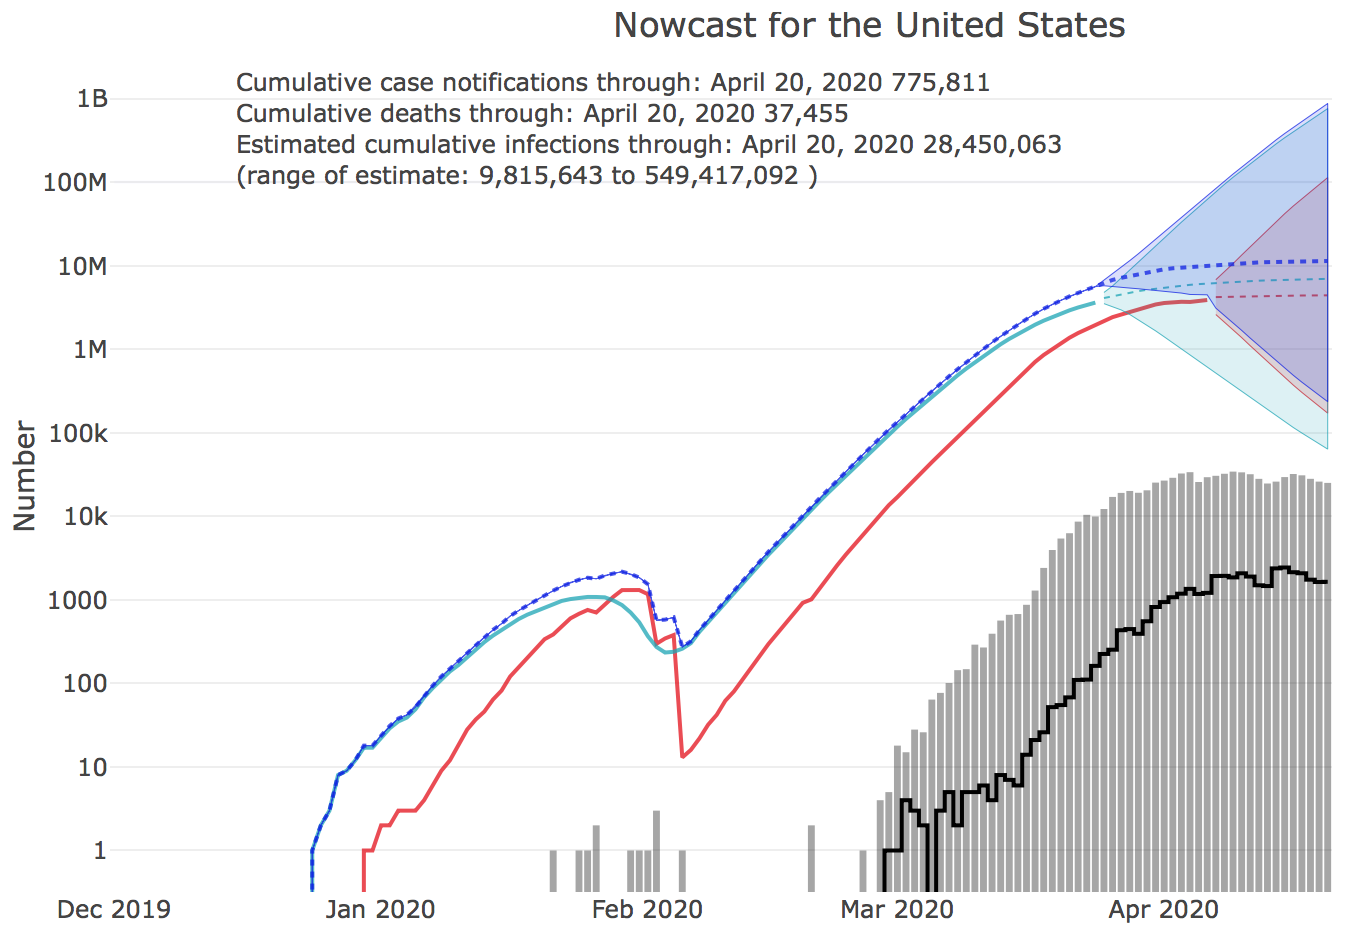
The Nowcast of the COVID-19 outbreak size by U.S. state has launched on the UGA CEID COVID-19 Portal. The nowcast is an estimate of the total number of unreported cases by state. Nowcasts are estimated for the 50 states and for the U.S. as a whole, and are calculated from COVID-19 case reports and fatalities. http://covid19.uga.edu/nowcast
Estimating the number of unreported cases from reports of fatalities requires compensating for the Infection Fatality Rate (IFR), currently estimated at 0.9%. IFR represents the percentage of cases that result in fatalities. During the outbreak, the death rate might appear to be larger because most cases are unreported. But in fact, we can use reports of fatalities and the IFR to estimate the number of actual cases that must have been present in the community dome time before the present. We can then forecast from that point in the past back to the present to derive an estimate of the total number of unreported cases at present.
Effect of early intervention
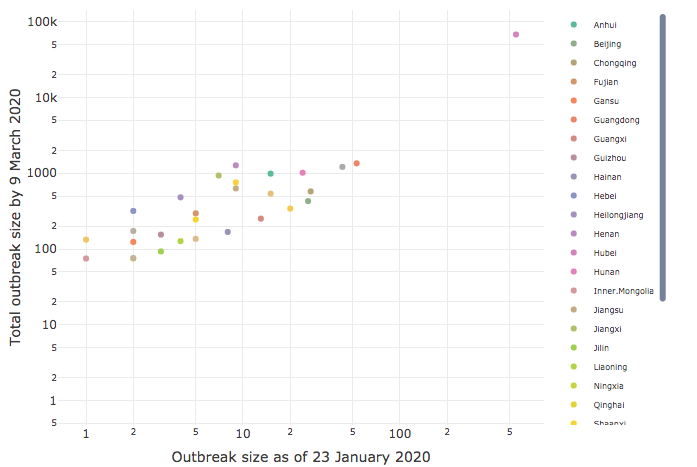
CEID has released an analysis of the effect of early intervention on its COVID-19 Portal. The analysis of intervention timing and outbreak size by province in China clearly demonstrates the importance of early intervention.
Based on a study of government intervention in China following the Initial outbreak of COVID-19 in Wuhan, Dr. Drake found a very strong correlation (90%) between how early a lockdown was imposed in a province and the ultimate severity of the outbreak there. The results show that early action yields critical gains, with every delay of 3.8 days leading to a tenfold increase in cases.
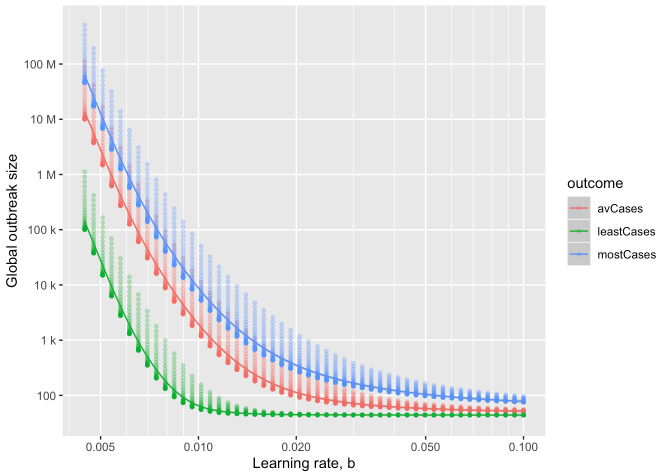
as a function of learning rate
Estimating final outbreak size
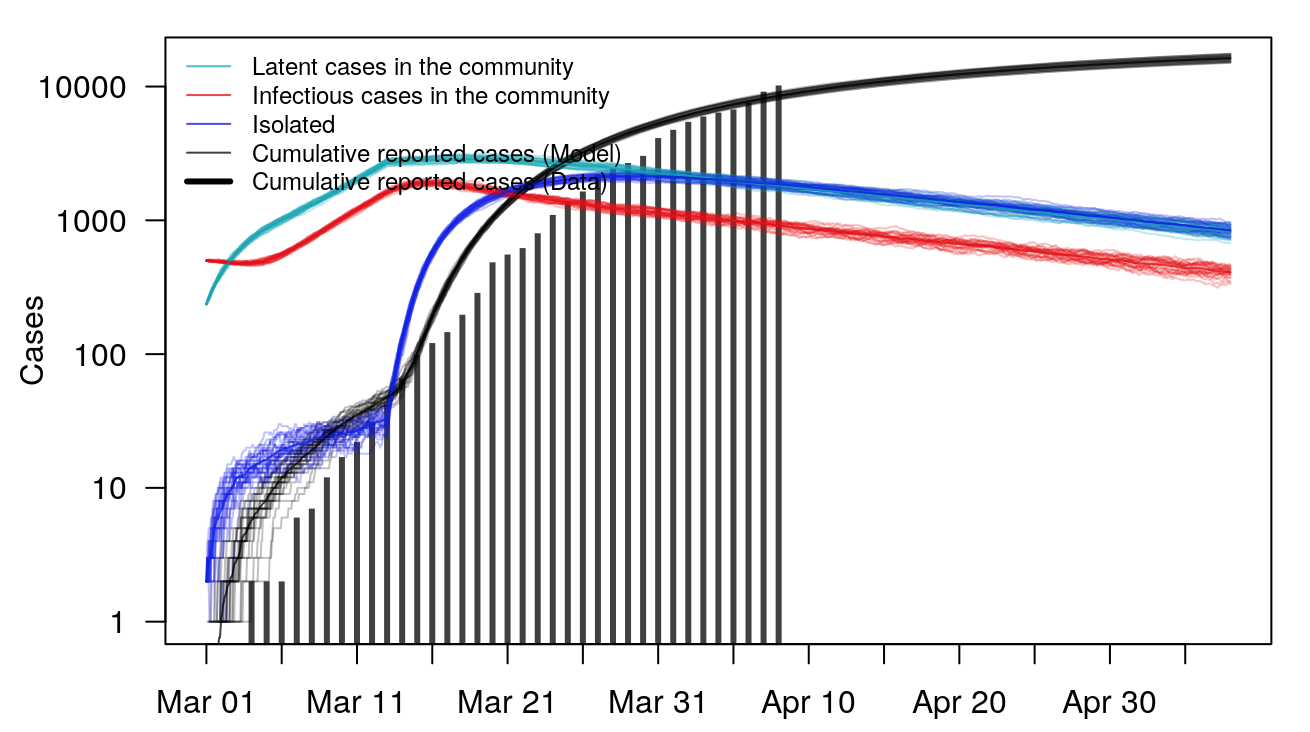
The CEID Coronavirus Working Group has developed a model to provide insight into the potential final size of the ongoing COVID-19 outbreak. The authors adapt a model previously developed for the recent Ebola outbreak.
In the model, multiple local outbreaks of a hypothetical disease are sparked (using what we know about epidemic characteristics of COVID-19). The model assumes containment improves over time due to better diagnostics and patient isolation, until the time that infectious individuals are in the community is shortened enough to halt spread. The rate of improvement in time-to-isolation, called the “Learning Rate,” has a strong effect on the final outbreak size, with rapid response greatly reducing the final outbreak size.
The model is scaled up to the size of a global epidemic by probabilistically incorporating the sparking of new outbreaks across the globe, resulting in a predicted distribution of ultimate outbreak sizes. The full model is useful in providing best-case, worst-case and average-case scenarios under a range of assumptions, especially before regional data is fully collected.
The global model shows how rapid response and limiting sparking are key to preventing pandemic. According to the model, average-case final outbreak sizes can vary over several orders of magnitude as a result of both how quickly local containment is achieved and how likely infectious individuals are to seed new outbreaks elsewhere.
Model details and estimates are available at http://covid19.uga.edu/final-size.
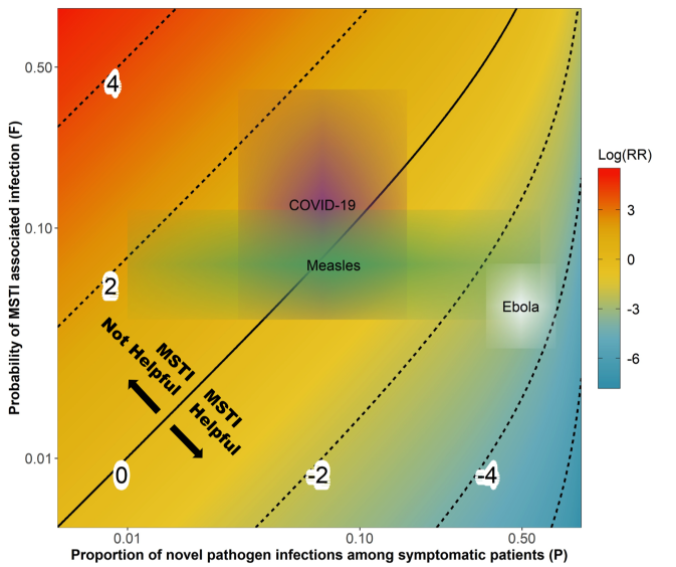
Assessment of mass screening and testing
The CEID Coronavirus Working Group has released an assessment of the impact of symptom-based mass screening and testing intervention (MSTI) during novel disease outbreaks to help understand how current mass testing and screening may be affecting the COVID-19 outbreak in China.
China is currently using a strategy of symptom-based mass screening and testing intervention (MSTI) for the COVID-19 outbreak. MSTI can identify a large fraction of infected individuals during an infectious disease outbreak. However, MSTI might lead to increased transmission if not properly implemented. The new study investigates which conditions MSTI is beneficial, comparing theoretical helpfulness of MSTI during outbreaks of COVID-19, Measles and Ebola.
Because COVID-19 shows general respiratory symptoms that are similar to common infections, MSTI might quickly overload the health system. MSTI might also lead directly to a worsening of the outbreak due to increased transmission at testing sites. This study presents a method for balance the risks and benefits of MSTI given known characteristics of novel pathogens.
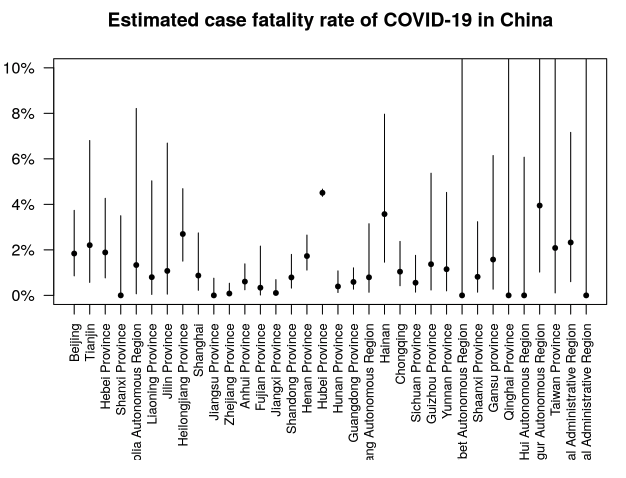
Estimates of case fatality rate added
Estimates of the case fatality rate CFR have been added to the Epidemic Characteristics page. The case fatality rate is the death rate among those with COVID-19 disease.
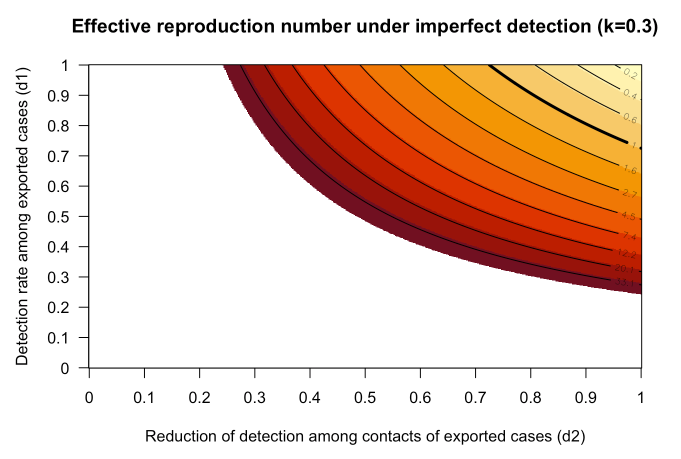
on estimates of Effective Reproduction Number
Effective reproduction number outside China updated
Estimates of the effective reproduction number Reff outside of China have been updated to account for heterogeneity in transmission. See R-effective outside China for details. Reff is the average number of secondary infections, taking into account immunity in the population and containment efforts. When Reff < 1.0 containment occurs.

based on micrographs of SARS and MERS.
(Credit: Chloe Parker)
Virus causing COVID-19 disease named “SARS-CoV-2”
The virus causing the current outbreak of COVID-19 has been officially named “Severe acute respiratory syndrome coronavirus 2” (SARS-CoV-2). For the first several weeks of the outbreak, the virus had been informally referred to as 2019-nCoV.
A manuscript describing the work of the ICTV Coronaviridae Study Group reports that the virus belongs to the existing species “Severe acute respiratory syndrome-related coronavirus,” and as such, is a sister to existing SARS-CoVs.
The official disease name, COVID-19, which was announced February 11, 2020, should not be confused with the official name of the virus itself, henceforth known as SARS-CoV-2.
on estimates of Effective Reproduction Number
R effective outside China
The CEID Coronavirus Working Group has developed a method to estimate the effective reproduction number Reff of COVID-19 outside China. The Effective Reproduction Number is the expected number of secondary cases to arise from an arbitrary case, taking into account immunity and containment efforts.
Inside of China, the related quantity “Basic Reproduction Number” (R0), which does not take into account containment or immunity, has been estimated at around 2, meaning on average an infected person would infect 2 other people in a population without immunity. This should be a basic property of the virus.
In contrast, Reff is expected to change over the course of an outbreak due to increasing immunity and containment efforts. Containment will occur when Reff < 1.
As of February 16, 2020, a number of cases of COVID-19 have been exported outside of China. Some of these have led to secondary transmission, while others have not. Some important questions include:
- Is the current level of vigilance adequate for detection and containment?
- What potential is there for sustained transmission in these settings?
CEID has now introduced a method to estimate the average effective reproduction number of cases exported outside China, relying on certain assumptions. The method and first estimates are detailed here: http://covid19.uga.edu/reff-outside.html

Based on micrographs of related SARS and MERS coronaviruses. (Image credit: Chloe Parker)
Novel coronavirus disease renamed COVID-19
The 2019 novel coronavirus disease has received its official name from the World Health Organization.
The new disease name, “COVID-19,” is a contraction of “Corona Virus Disease 2019”, indicating that the outbreak began in 2019, and is caused by a novel virus in the coronavirus family.
The novel virus itself is still unnamed, and is being referred to as 2019-nCov. ICTV will be the official authority on naming the virus.
UPDATE: The virus has since been named SARS-CoV-2.

Based on micrographs of related SARS and MERS coronaviruses. (Image credit: Chloe Parker)
Announcing the Coronavirus Tracker
The UGA Center for the Ecology of Infectious Diseases (CEID) launches its new Coronavirus Tracker today. The tracker is the work of CEID’s Coronavirus Working Group, convened to provide timely, data-driven situation awareness about the 2019 novel coronavirus outbreak.
Due to the lack of prior data during the emergence of a novel pathogen, the ability to respond quickly and effectively depends on the timely assessment of information collected in real time. On January 24, 2020, the CEID formed the Coronavirus Working Group, a group of about 20 scientists with data science expertise in data manipulation and interpretation, visualization, GIS, machine learning, computational statistics, and dynamical modeling.
The Working Group’s Coronavirus Tracker provides data-driven, information rich situation awareness about the rapidly changing conditions of the current outbreak.
Activities include:
- Mapping the spatial spread of the virus within China and abroad
- Developing models for understanding the early stages of transmission and extrapolation to future events
- Estimating key parameters related to transmission
- Compiling clinical and epidemiological information to aid in the development and interpretation of model outputs as well as understanding of events as they are observed
- Assessing the effectiveness of public health interventions on containment
UPDATE: The Coronavirus Tracker was renamed the COVID-19 Portal and has migrated to covid19.uga.edu.